Air quality index values for zones monitored over the month of:
October 2024
The index corresponds to the average concentration of particle matter measured in micrograms / m3;
the lower the value, the better the air quality.
The average environment of the Toulouse region
PM 10
Toulouse Inside Peripheral Ring
Acceptable
Toulouse Suburd
Good
Castanet-Tolosan
Good
PM 2.5
Toulouse Inside Peripheral Ring
Good
Toulouse Suburd
Good
Castanet-Tolosan
Good
Environmental quality averaged over the period under review is good in the city of Toulouse and its suburbs. However, these values show a degradation compared with the previous month, which had been very good, but are now back to levels equivalent to those seen at the start of the summer.
The averaged values presented take into account measurements from citizen sensors and official Atmo Occitanie sensors.
Detailed environment of the Toulouse region
Average PM 10 measurements (readings in micrograms / m3)
The averaged PM10 values show a satisfactory situation this month, although the values are up on the previous month. The highest values are found in the eastern part of the conurbation and on the city’s ring road, as measured by official sensors (in blue circles). The maximum value of 22 at Rangueil remains the critical point in the city as a result of the road traffic at this point.
The measurement points near the airport (Blagnac) and to the north of Toulouse show a relatively undisturbed environment.
The few high values (between 12 and 15) on the outskirts (west – east and south) on citizens’ sensors are the result of a few periods of fog that somewhat disturbed these sensors (detection of water droplets in suspension rather than pollution – see detailed graphs below).
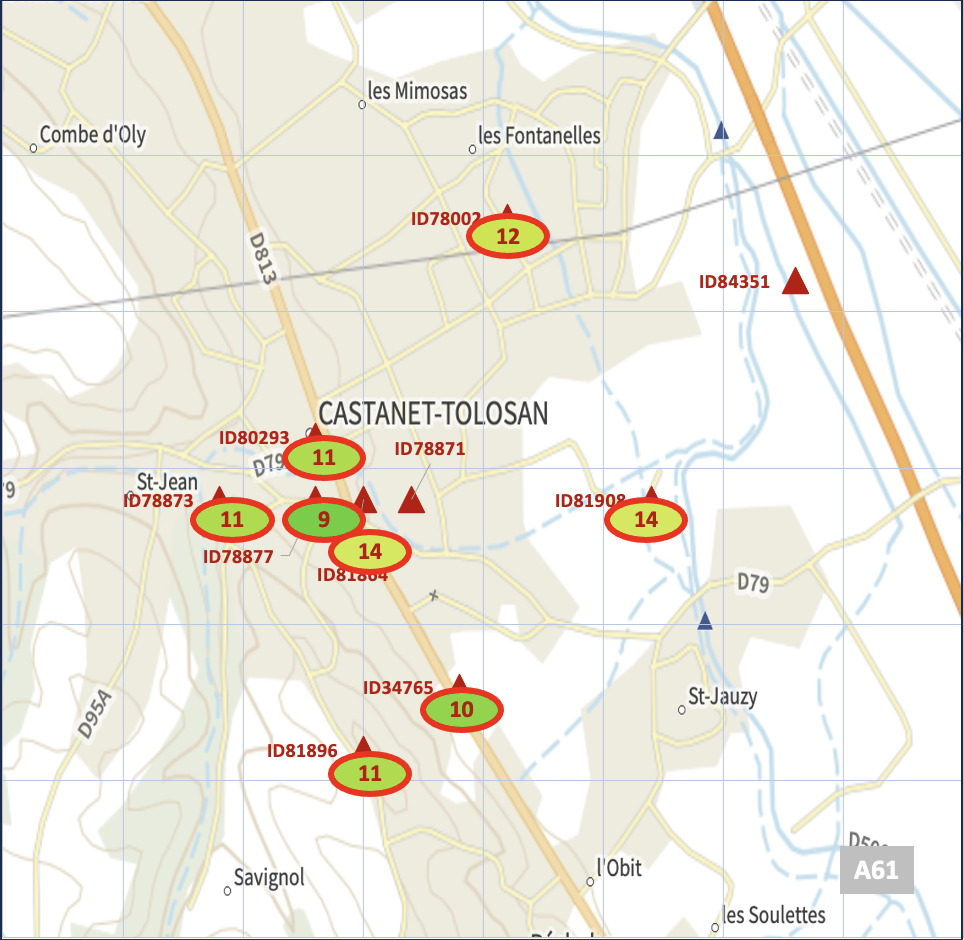
Special focus on Castanet-Tolosan
Average PM10 measurements
Average PM 2.5 measurements (readings in micrograms / m3
Citizen sensors can assess PM10 and PM2.5 concentrations at the same time, which is not the case for all official sensors.
In general, the values are low, but slightly above the minimum standards for this type of particle, but there is no real cause for concern.
Average PM2.5 measurements
Temperature evolution over the present month
PM10 concentration over the present month
PM2.5 concentration over the present month
Identifying periods of fog
Citizen sensors are particularly sensitive to periods of fog, which can be identified in the raw PM10 readings; as the sds011 sensors detect particles without actually measuring their mass, the presence of fog droplets (generally between 20 and 8 microns) greatly disturbs the corresponding mass measurement (see peaks well above 100 micrograms). The phenomenon is less noticeable in PM2.5 measurements.
View on officials sensors
Official sensors, which are more sophisticated and generally measure the mass of particles, are therefore less sensitive to the phenomenon of fog. They are generally located in urban areas, whereas many citizen sensors are also located in rural areas, which are more subject to the effects of periods of fog.
The graphs below only show readings from Atmo Occitanie stations in Toulouse. The period from 1 to 24 October corresponds to the data disseminated by Atmo; a change in the method of dissemination to the general public meant that it was not possible to acquire data up to 31 October. The measurements presented from 25 to 31 October correspond to data from the European Environment Centre. There are fewer stations measuring PM2.5 concentrations than those measuring PM10.
A comparison with all the citizen sensors shows similar periods of disturbance around 8 and 16 October. The period at the end of the month, which is less well documented, is less noticeable.