A site for sharing information
on air quality between citizens
Air quality is affected by a number of components, including fine particles that affect the respiratory tract and irritating gaseous compounds.
When air quality deteriorates sharply, it can sometimes be smelt, but more rarely seen. Only measurements can describe the state of the air, enabling citizens to be reassured or alerted so that they can adapt their lifestyles.
Measurement of fine particles 24h/24h
Thanks to sensors installed by responsible citizens.
Citizen network
Data recovery via a network linking all the players.
Operation and distribution
The data is processed and the results disseminated thanks to committed citizens.
An ecological and scientific approach to citizenship
Citizens are becoming increasingly aware of the importance of air quality, especially in large conurbations. The Covid 19 crisis has heightened this perception, prompting individuals to take a better look at their environment.
Today, sensors for measuring air quality, mainly fine particles and CO2, are available on the market or from associations.
This site presents what citizens can gather from their sensors when their data is pooled.
An initiative in Toulouse (France)
The city of Toulouse and its suburbs boast a concentration of measurement sensors, providing a global view of air quality in the region.
This specificity, combined with a desire to gain a better understanding of the measurements acquired, led to the creation of this site, which focuses primarily on the environment of the Toulouse region.
2024 ... One year of data processing
Over the course of 2024, numerous sensors in the Greater Toulouse area were analyzed, and the results have been presented on this site every month since its creation (June 2024).
The synthesis of analyses over the whole year presents an evolution of the agglomeration’s environment, the results of which are full of lessons to be learned.
In addition to Toulouse, two other cities in France have been equipped with citizen sensors, enabling us to carry out an appropriate analysis: Paris and Rennes. So, for the sake of comparison, the site also took a limited interest in these two other cities.
Rennes
Rennes is also specific in having a community of citizens mobilized to monitor their environment through a local association. In harmony with the analysis approach implemented for Toulouse, the measurement results for the Rennes conurbation are presented here over a limited period (June 2024):
Paris is the area with the highest concentration of air quality monitoring sensors in France, both official and citizen sensors. It is also one of the cities most affected by deteriorating air quality.
Analysis of the data available from both official and citizen sensors is highly interesting and instructive for citizens in understanding their environment and encouraging them to do their own monitoring.
Gradually a broader vision ..... in the European environment
Citizen analysis of air quality can lead to the emergence of new initiatives, and several university centers are taking an interest in the subject, sometimes looking at the link between pollution and health. For example, the University of Mainz in Germany is looking for a correlation between pollution levels and the occurrence of certain heart diseases among residents of the areas studied. Although the correlation is difficult and not self-evident, the initiative is worth trying to go further than simply transcribing measurements.
With this in mind, an initial analysis of the environment in Mainz has been carried out, and is presented in the corresponding article:
Environmental monitoring in the Toulouse region (Haute-Garonne - France)
The citizens’ group is based in Castanet-Tolasan, a commune on the outskirts of Toulouse (south-west France) and is interested in the overall environment of the Toulouse region.
It is based on a local network of low-cost sensors set up by various local residents. These sensors are dedicated to measuring the concentration of fine particles (PM10 and PM2.5, i.e. particles around 10 microns and 2.5 microns in size). The data is centralised within an international community called the ‘Sensor Community’ and made public on the community’s website.
Environmental quality averaged over the period under review is acceptable in the city of Toulouse and its suburbs. These values nevertheless show an improvement on the previous month, when measurements were disrupted by a damp environment (fog).
The detailed readings presented below show levels generally above the WHO standard, with frequent measurement peaks resulting from periods of fog, especially on the outskirts of Toulouse, explaining the high PM10 indicator opposite. As a reminder, citizen sensors are sensitive to the effects of fog, leading to values that are generally in excess of reality.
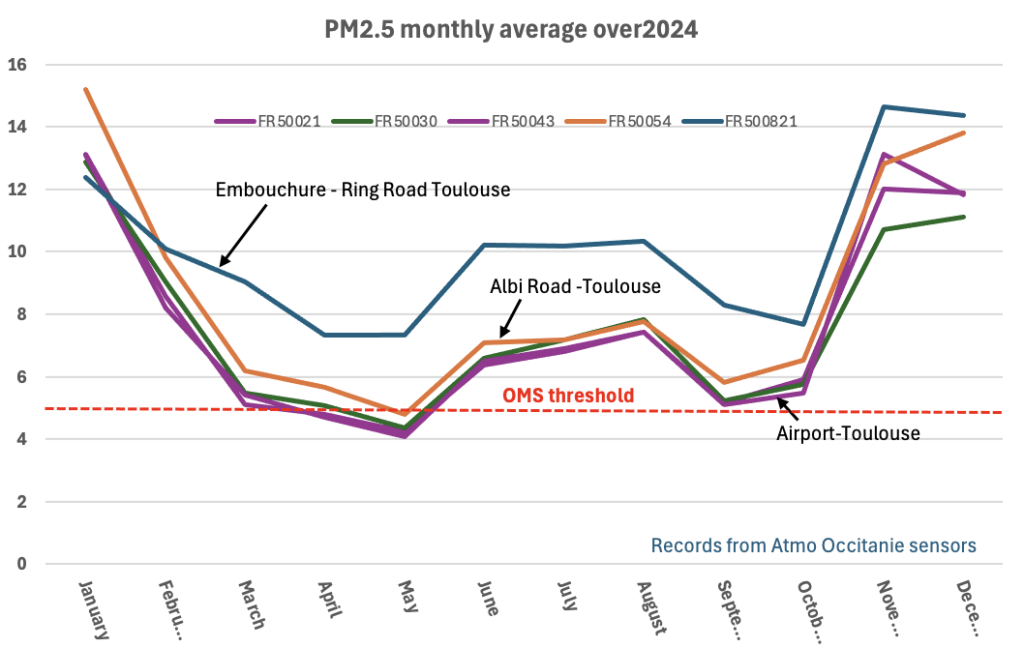
The average values presented take into account the measurements of the citizen sensors and those of the official Atmo Occitanie sensors.
Translated with DeepL.com (free version)
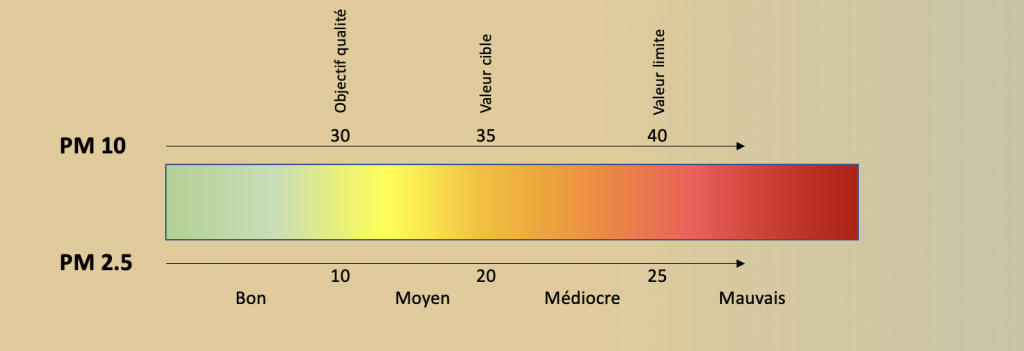
The colour scale opposite is the classic transcription of concentration values in terms of air quality. This interpretation is less severe than the consideration of the new WHO standards as taken into account in the analyses of the various measurement curves presented in the corresponding tab.
Air quality indicators
Air quality index values for zones monitored over the month of :
December 2024
PM 10
Toulouse inside the ring road
Acceptable
Toulouse Suburb
Medium
Castanet-Tolosan
Good
PM 2.5
Toulouse inside the ring road
Good
Toulouse Suburd
Good
Castanet-Tolosan
Good
Variations in local measurements
The following figures show the corresponding average values for each operational sensor, and give an idea of the variations by district and around the conurbation.
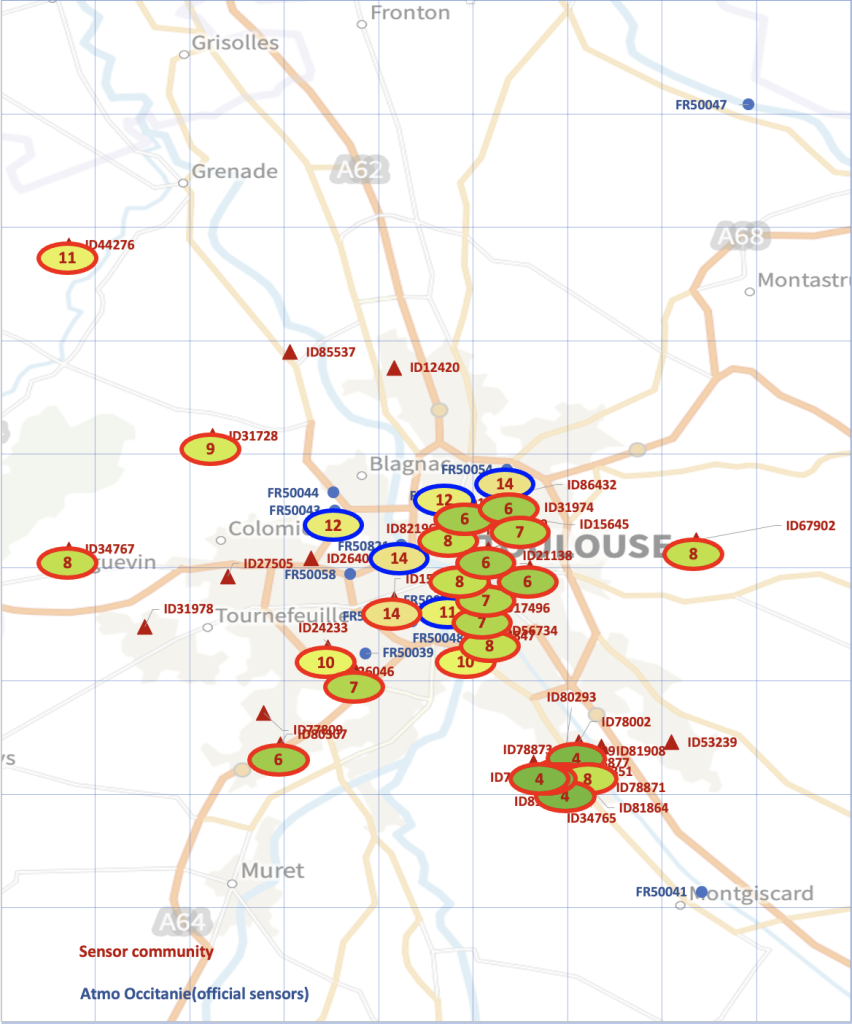
Detailed environment of the Toulouse region
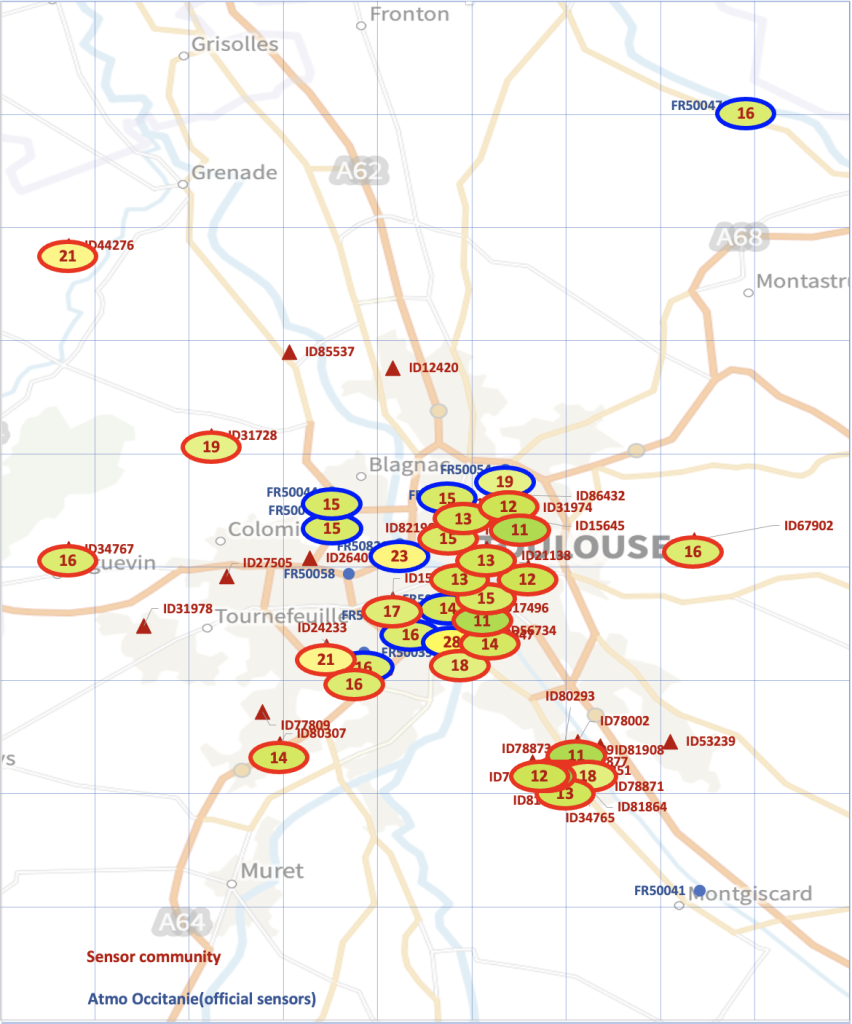
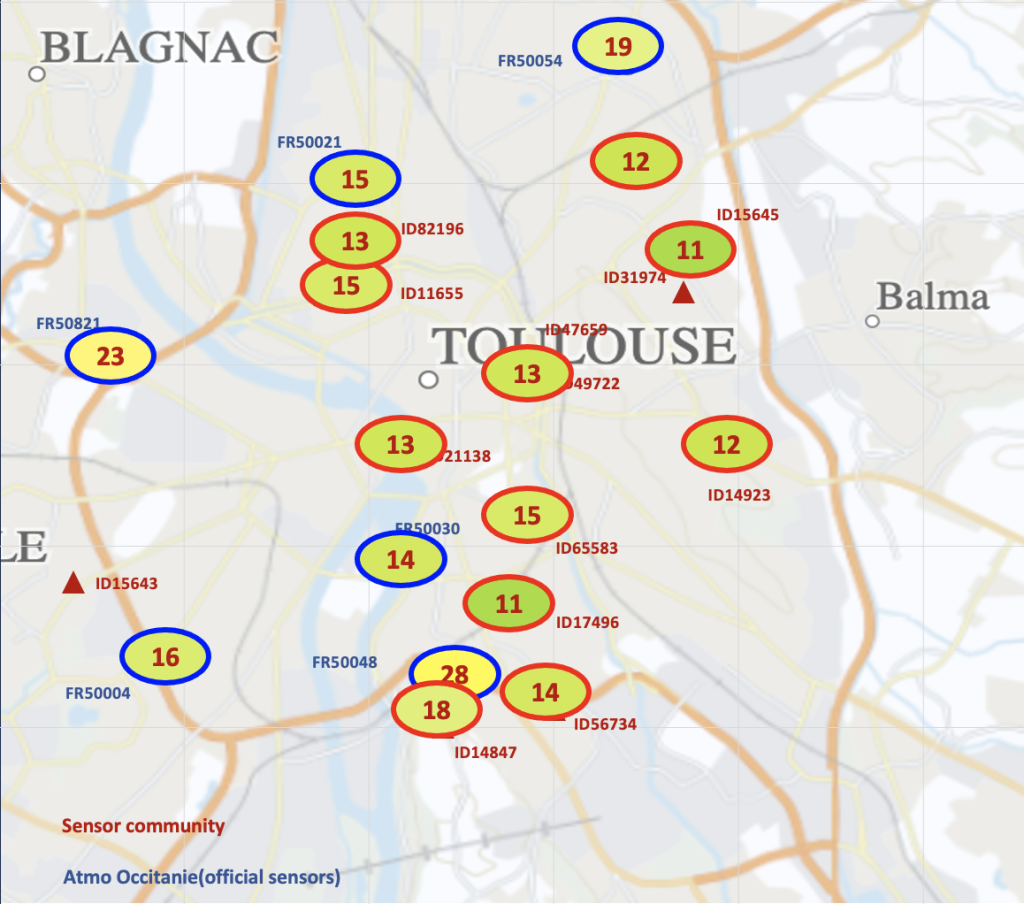
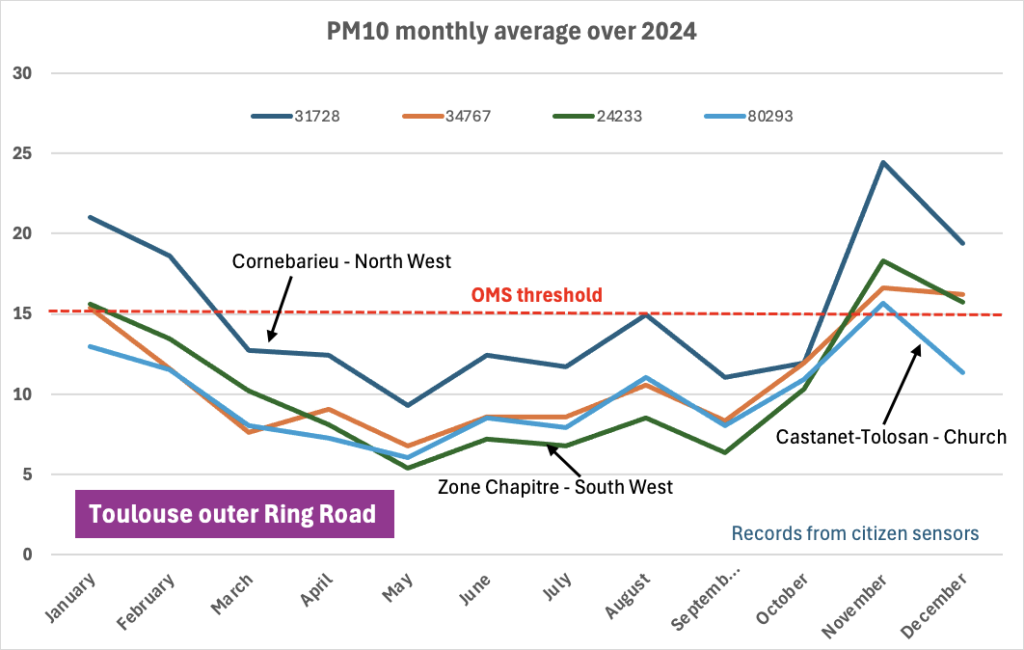
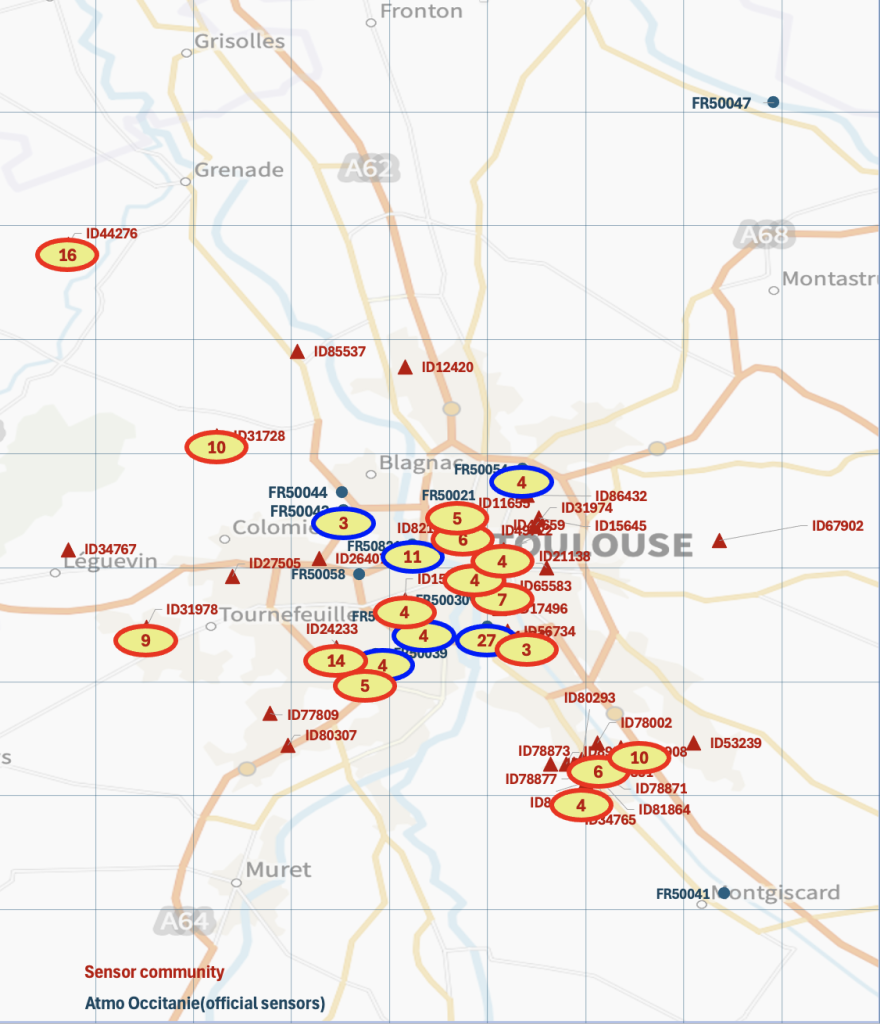
Average PM 10 measurements (readings in microgrammes / m3)
Averaged PM10 values show an acceptable homogeneous situation over the month in the inner city. Values on the city’s ring road, based on official sensor readings (in blue circles), are high at the two usual high-traffic points (Rangueil -28- and Embouchure -23).
Measurement points near the airport (Blagnac) and to the north of Toulouse show a moderately disturbed environment.
The few high values (between 16 and 19) on the outskirts (west – east and south) on citizens’ sensors are the result of periods of fog somewhat disturbing these sensors (detection of suspended water droplets rather than pollution).
The northern and eastern parts of Toulouse, where there are no sensors, cannot be properly assessed.
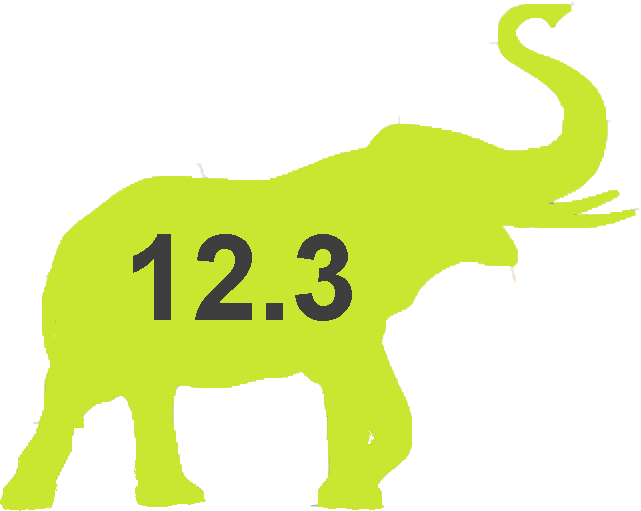
Dedicated values in Toulouse
Average PM 10 measurements
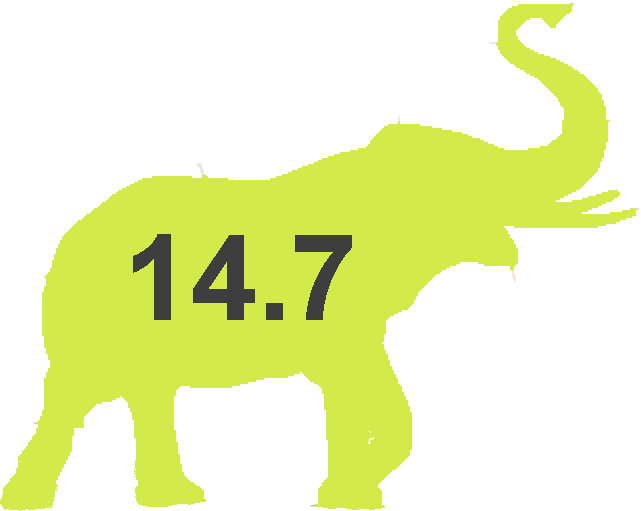
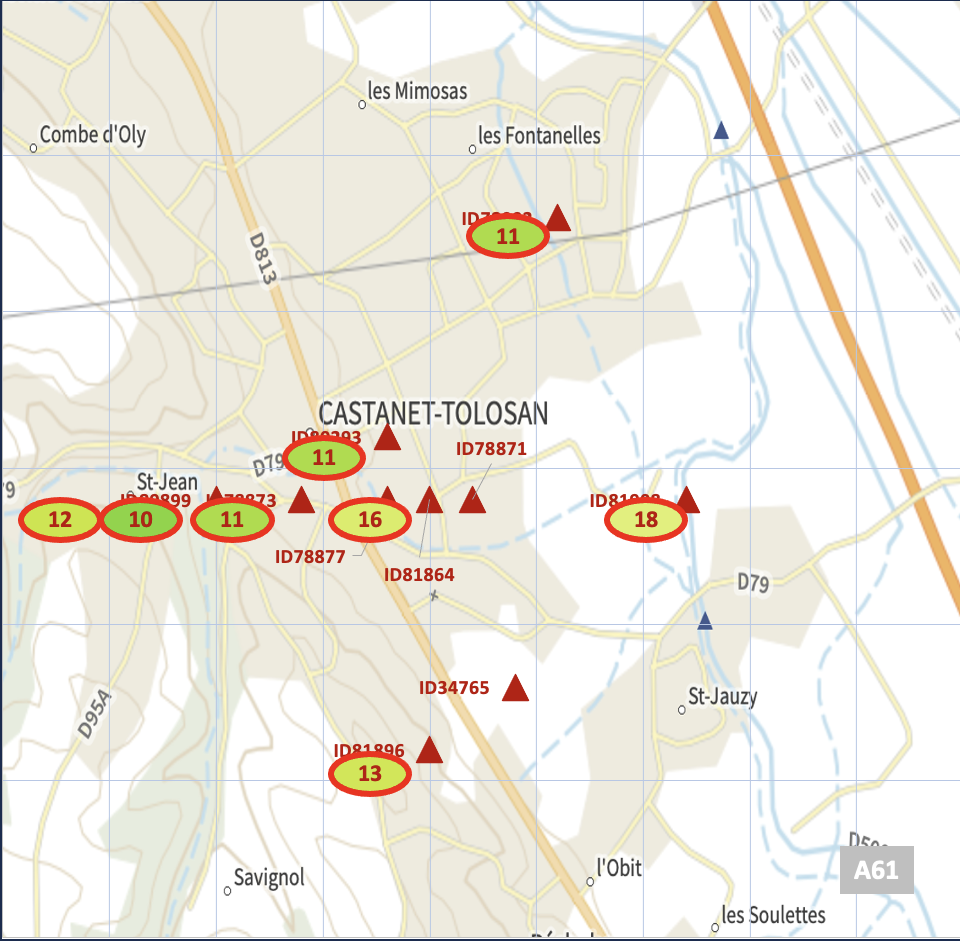
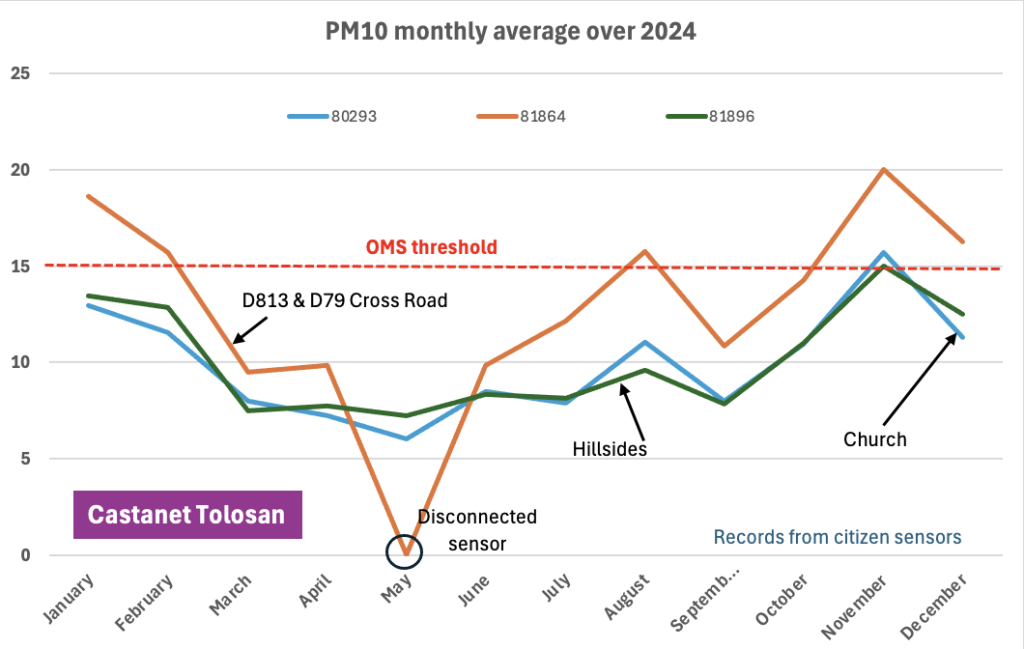
Special focus on Castanet-Tolosan
Average PM 10 measurements
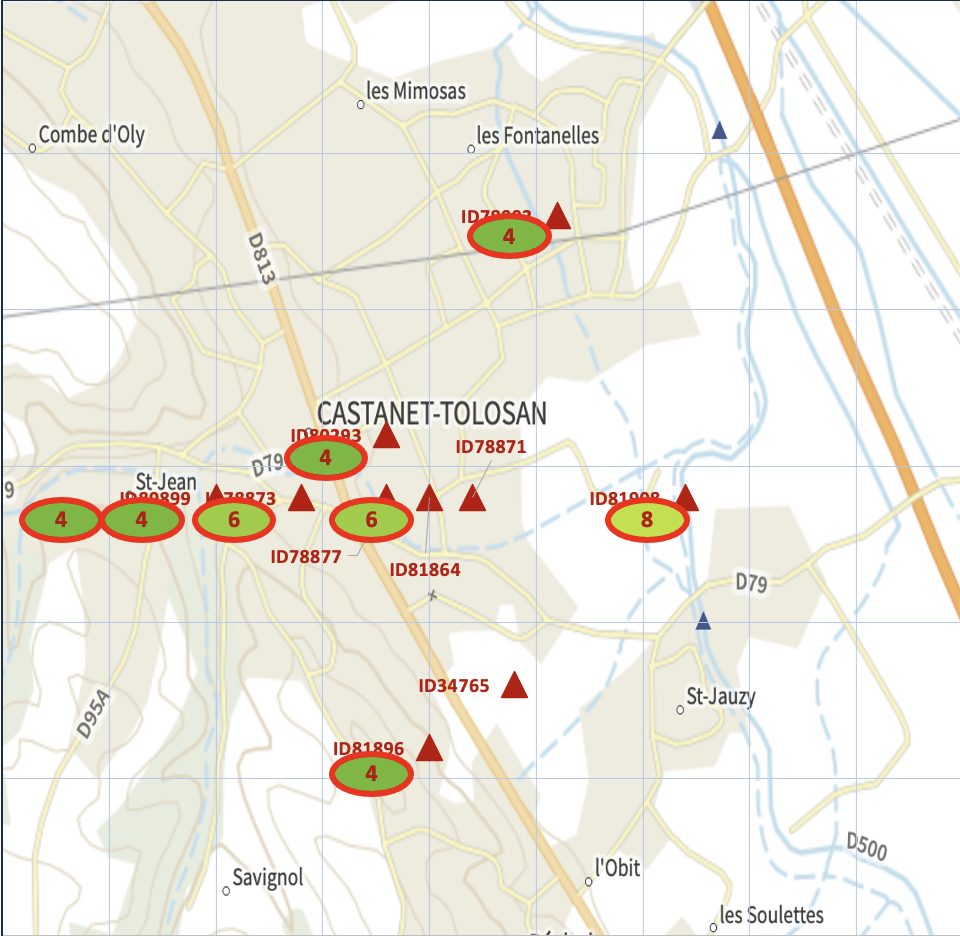
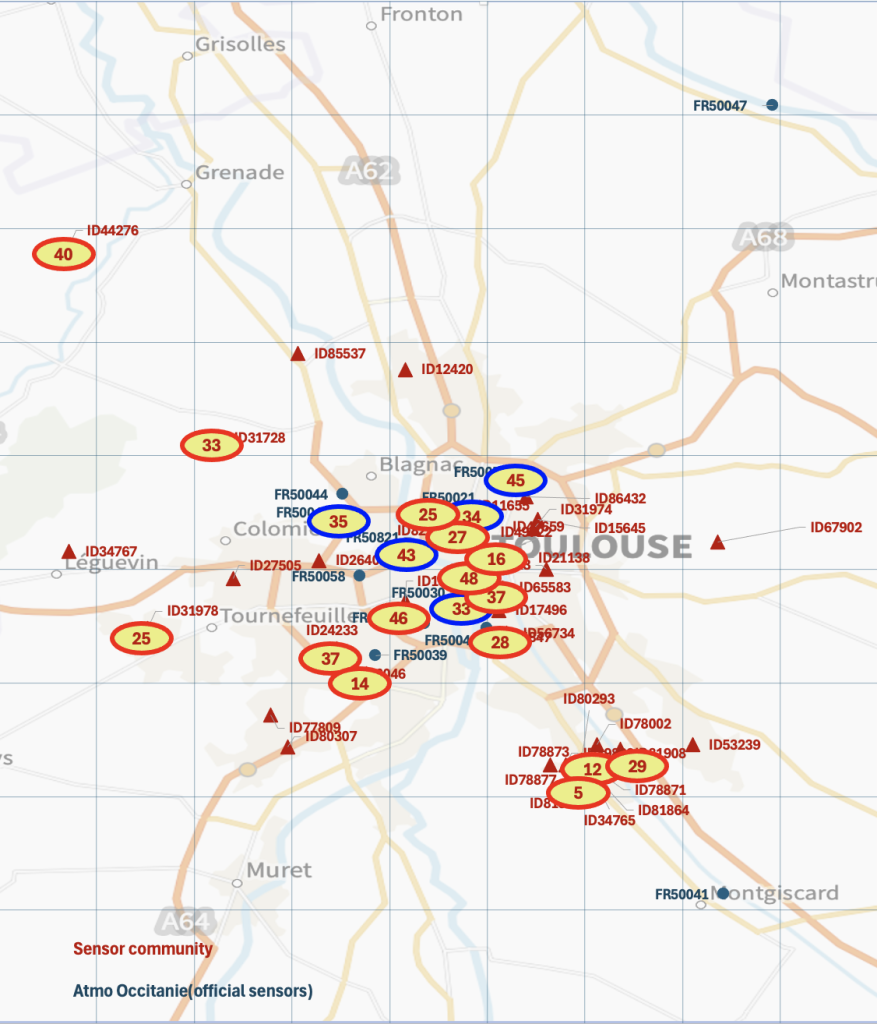
Average PM 2.5 measurements (readings in micrograms / m3)
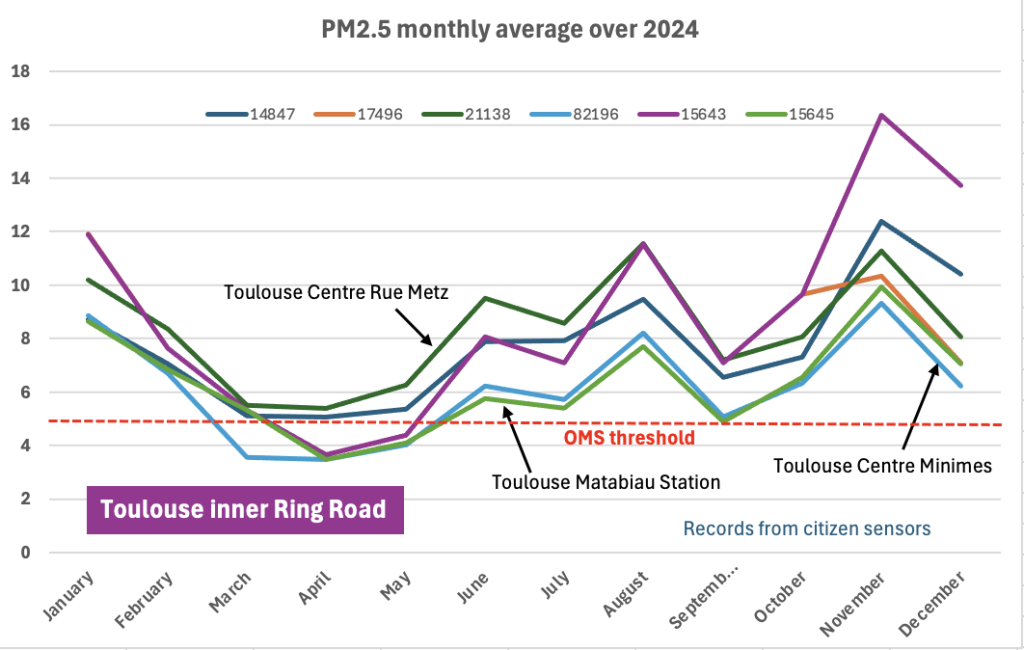
Citizen sensors can simultaneously assess PM10 and PM2.5 concentrations, which is not the case with all official sensors.
Generally speaking, the values are low, but a little above the minimum standards for this type of particle, but there’s no real cause for concern.
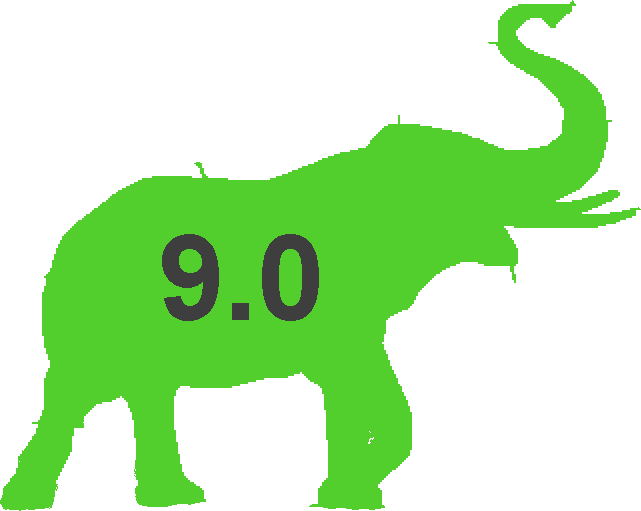
Toulouse southern ring road at Rangueil
Average PM 2.5 measurements
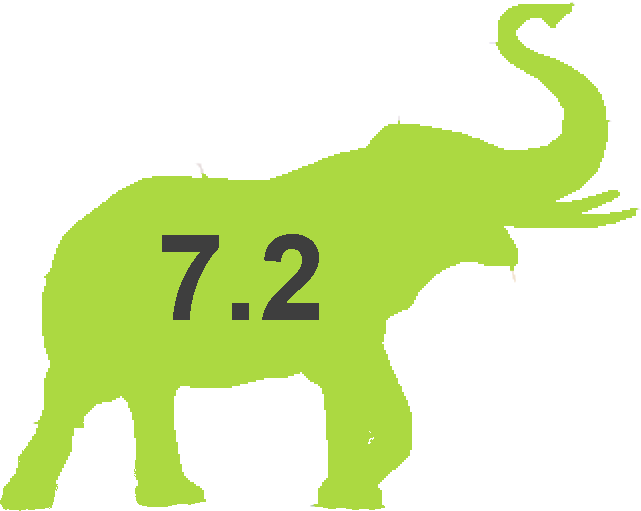
Average PM 2.5 measurements
Dynamic visualisation of particle concentrations
Much more than a map of local averages, the dynamic display shows particle concentrations in all locations at all times. This representation is an interesting way of assessing the criticality of a given location in relation to the overall environment of an area.
PM10 concentration trends in the Toulouse region
Visualisation
PM10 and PM2.5 in Toulouse
The two videos opposite show the environment considered over the period December 1 to December 31 2024. The accelerated speed corresponds to approximately 4 hours every second.
All valid measurement points (Atmo Occitanie sensors in Toulouse and citizen sensors) are taken into account in these simulations.
PM2.5 concentration trends in the Toulouse region
Decryption
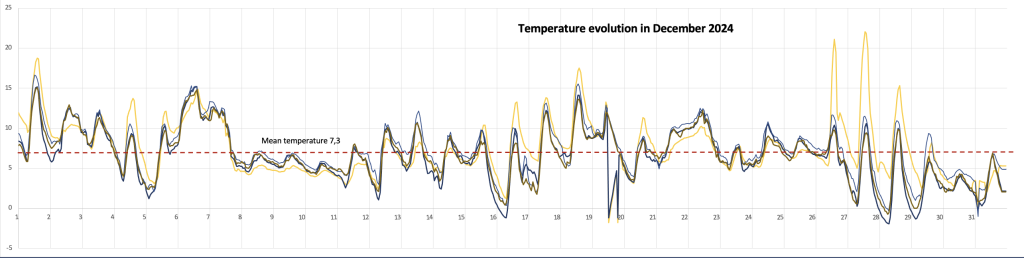
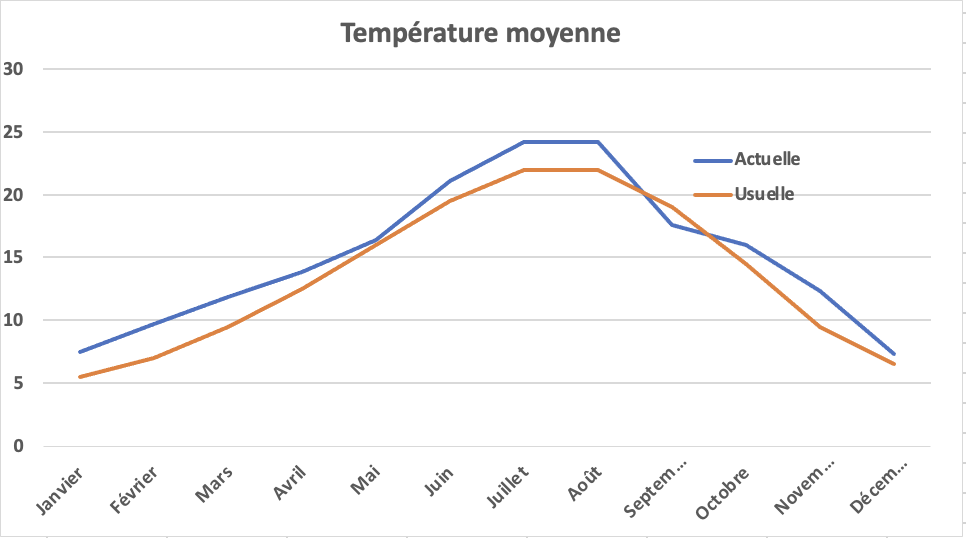
Temperatures in December were slightly above the average for recent years.
The first week was warmer than the following ones, a sign of a winter that has struggled to establish itself.
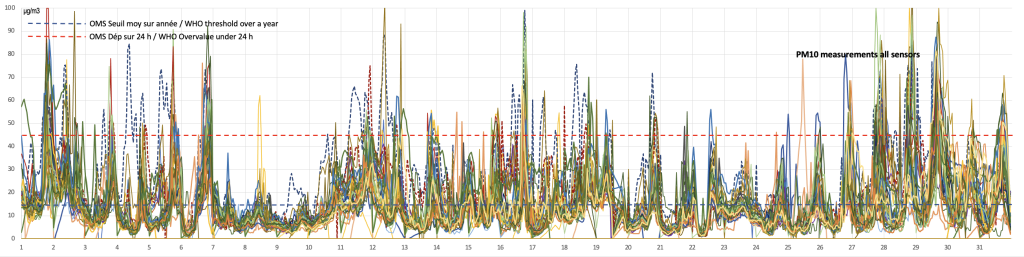
The detailed curves below for PM10 and PM2.5 show an average phase above the standard WHO value. However, this impression is clouded by a number of disturbances (peak values), with three specific phases at the beginning, middle and end of the month.
Year 2024 in review
A full-year cycle of analyses has been carried out and presented since the site was created (each detailed monthly result is listed in the monthly trend tab).
The curves below illustrate the results.
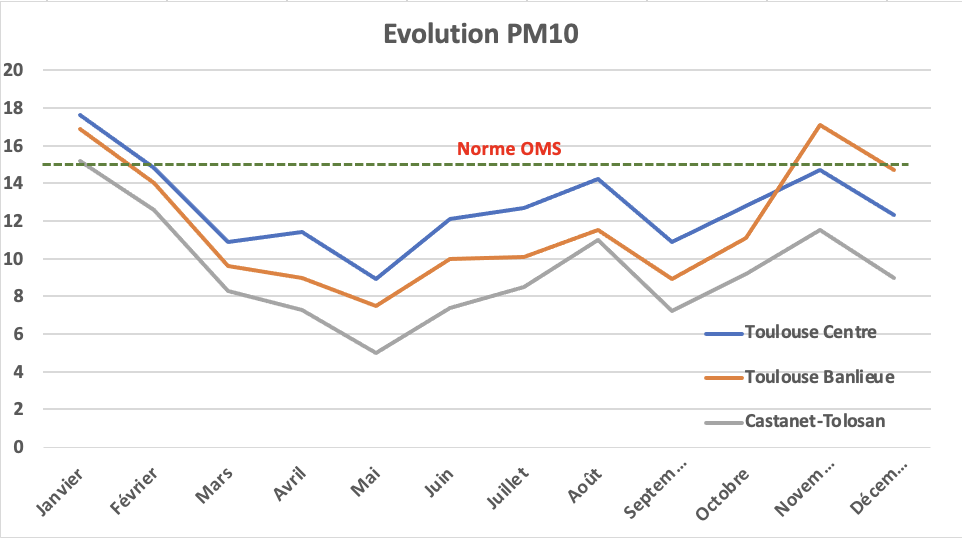
The year 2024 is catalogued as having been the warmest year of the industrial era; this is perfectly reflected in the average temperature record compared with the expected standard average, of which only September was below the usual statistics (rainy month).
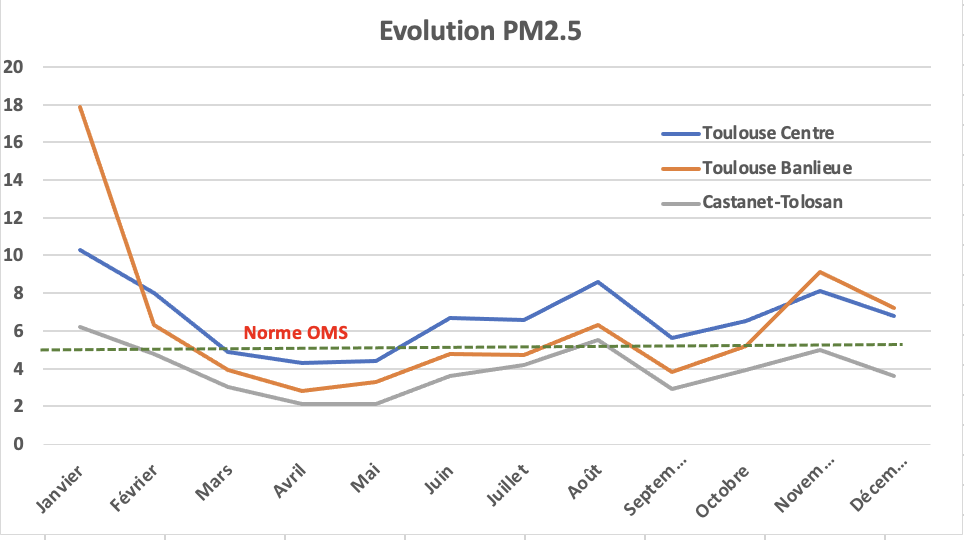
PM10 concentration values are generally below the WHO recommended value at all points in the Toulouse region. On the other hand, concentrations of fine particles PM2.5 are more critical and exceed the WHO standard, particularly in the inner suburbs of Toulouse; this phenomenon has been well identified by the regional authorities, leading to restrictions on the categories of vehicles authorized to circulate in the city.
Overall, particle concentrations are higher during the cold season, lower during temperate periods and rise again during the summer.
Changes in particle concentration are the result of a combination of natural phenomena and wind-borne effects (e.g. clouds of sand particles from Africa, pollen dispersion, residues from natural fires, etc.), as well as human activities in urban areas. The
period of average concentration, spring and autumn, corresponds to a phase of normal activity with no particular climatic constraints. Toulouse and its suburbs being an industrial region with low-polluting industries, average levels of particulate pollution are in line with current standards during this period.
– the summer period, during which, in addition to normal activity, human activity linked to the summer season (e.g. tourism, increased road traffic, etc.) contributes to ambient particulate pollution, along with potential specific climatic events (local fires, etc.).
– the cold period, late autumn and winter, during which heating emissions (particularly wood burning) are a predominant contributor to particle generation.
Local summaries
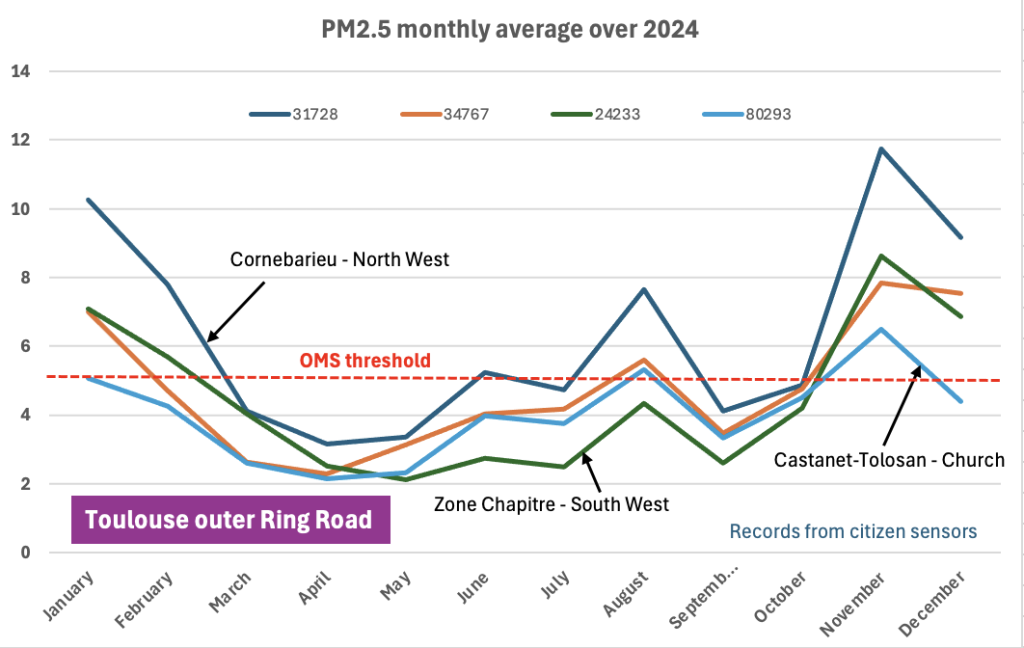
To confirm the influence of these various factors, a trend analysis of specific points in the conurbation provides a specific view, for example:
annual trends on major roads (specific points on the ring road)
trends in active districts (town centers, industrial zones, etc.)
trends in rural areas.
Through official Atmo Occitanie sensors
Measurements on major traffic arteries (ring road or main roads) are obtained mainly from official sensors. Particle concentrations are high all year round, particularly for 2.5-micron fine particles.
Confirmation with citizen sensors
Main points in Toulouse
In the center of Toulouse, while PM10 concentrations are acceptable, they are considered critical almost everywhere with regard to PM2.5 particles according to the WHO standard.
The suburbs of Toulouse
The Toulouse suburbs (i.e. away from the ring road) present a more acceptable situation, with the exception of the north-west zone near the airport (Cornebarieu) for PM2.5.
Specific to Castanet-Tolosan
Castanet-Tolosan offers no particular advantage in terms of its overall suburban image. Castanet-Tolosan is a major transit point, which makes it particularly sensitive to the intersection of its two main traffic arteries.
Slightly, moderately or heavily polluted?
The curves above show readings averaged over the duration of each month, compared with the recommended WHO standard as an average value over the year. We can see that certain parts of the Toulouse conurbation are critical, particularly with regard to PM2.5 fine particles.
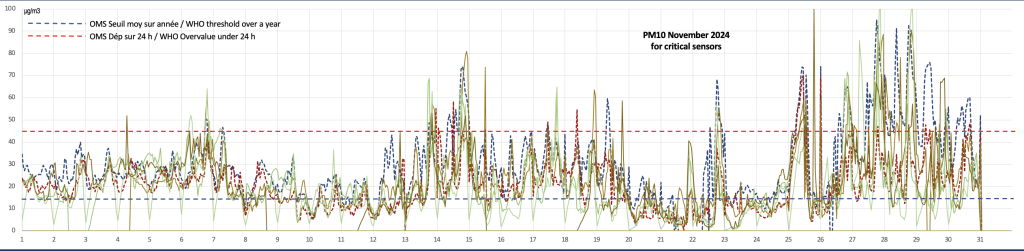
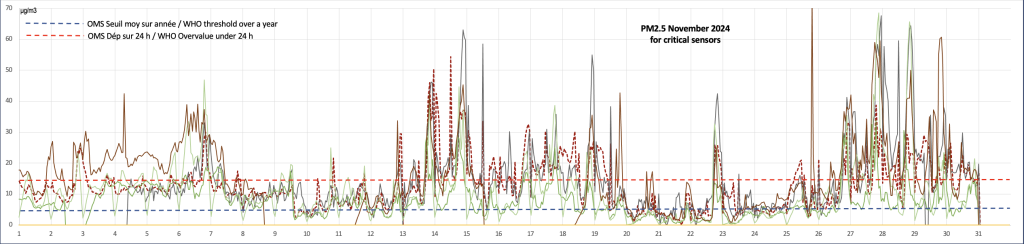
But what happens when high concentration peaks occur during specific events?
For example, in November 2024, some sensors showed significant peaks over two or even three periods. The monthly average is therefore high, but remains below the WHO standard for exceedances over 24 hours, with a relatively critical phase at the end of November.
The WHO high value standard (24-hour exceedance) therefore makes it possible to characterize exceedances above this high value by counting their cumulative duration above the recommended value (45 micrograms/m3 for PM10 and 15 micrograms/m” for PM2.5). The WHO standard recommends not exceeding the equivalent of 4 days a year for these high-emission periods.
The maps below show the cumulative duration (in days) over 2024 of measured exceedances of this WHO standard.
Cumulative annual duration (days) above the WHO PM10 standard
Cumulative annual duration (days) above the WHO PM2.5 standard
In the Toulouse region, we note that:
the duration of exceedance of the tolerable PM10 value of 45 micrograms/m3 remains reasonable, apart from for specific points on the ring road (27 at Rangueil and 11 carrefour de l’embouchure – based on measurements from official sensors) and for a few points on the outskirts (citizen sensors). The average equivalent value over this period was 57 micrograms/m3, i.e. 29% above the recommended value of 45.
the duration of exceedance (>15) in PM2.5 is well above the recommended value (4 days), reaching 45 to 48 days at some points (i.e. 12.5% of the time). The average equivalent value during this period was 22 micrograms/m3, well above the recommended value of 15 (+47%).
These results confirm the critical nature of fine particle pollution (particularly PM2.5), especially in the center of Toulouse.