
A citizen network to monitor air quality
Rennes and its conurbation
An environmentally conscious community
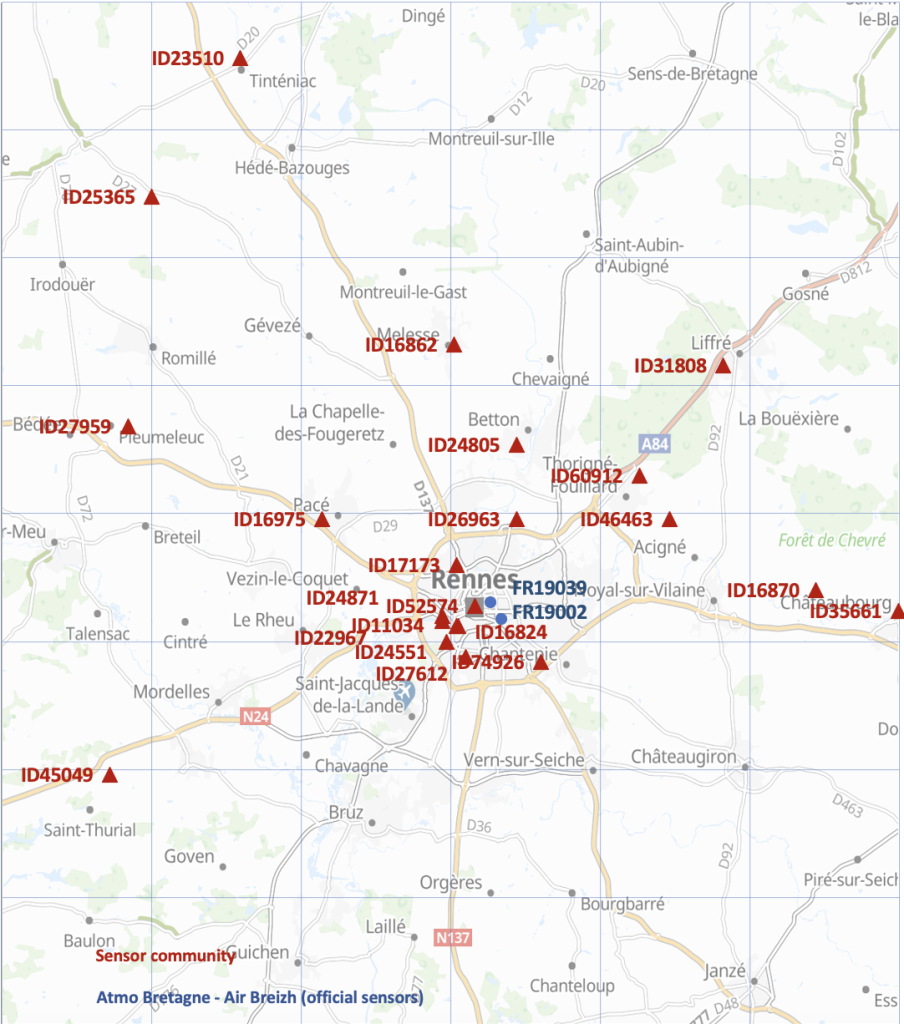
The development of a network through the “sensors community” has been underway for several years (sensors Idxxxxx) in the Rennes region (France).
Rennes is one of the three best-equipped urban areas in France, after Paris and Toulouse, which is why we were interested in this network. However, the scale of this network, like others in France, remains limited compared with other countries in Europe and the rest of the world.
The Rennes community used to publish its data on the Wiki Rennes Métropole website (wiki-rennes.fr), but the content (in French) no longer seems up to date.
A number of sensors identified on the “community” map (mainly in the south of the conurbation) appear to be faulty and give unreliable measurements; they have been eliminated from the present study and do not appear on the map opposite.
Air quality in Rennes is officially measured by two Atmo Bretagne (Air Breizh) sensors located in the city center and identified by FRxxxxx. Their measurement data can be retrieved from the Air Breizh website and have been processed to serve as a reference for the citizen sensors (calibration).
The operational sensor network
Analysis of the Rennes sensor network in June 2024
The aim is not to carry out an extensive study of air quality in Rennes, but to provide a snapshot over a short period (June 2024) of the measurements available through the current network. This approach is carried out using the same processing methodology applied to the Toulouse conurbation. It plots PM2.5 and PM10 concentrations only; an analysis of other air pollutants is feasible, but only for the two official sensors whose monitoring area remains limited.
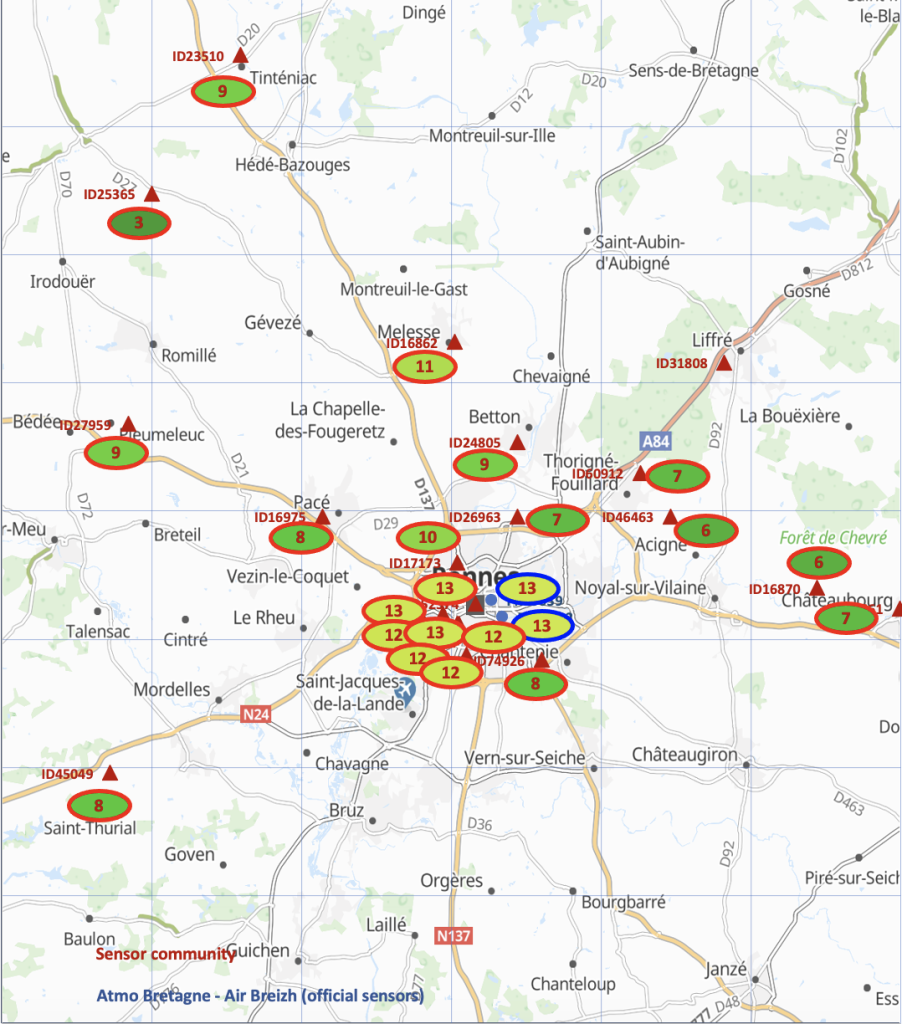
PM 10
PM 2.5
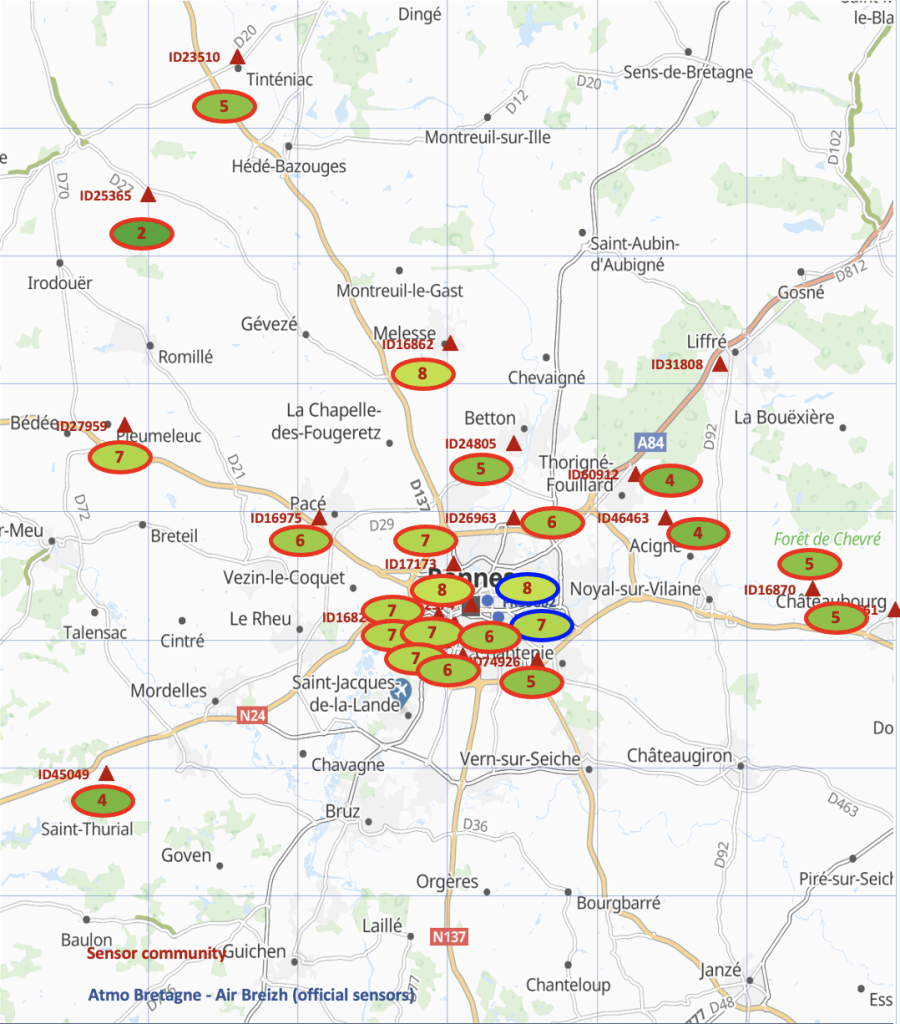
PM 10 and PM 2.5 values averaged over June 2024 for each operational sensor.
Overall balance
The concentration of fine particles in the city of Rennes is globaly homogeneous. This polution is probably due to road traffic, most of which is concentrated in the western part of the city.
The outer suburbs of Rennes (north and south) appear to be less affected.
Three sensors give values outside the norm:
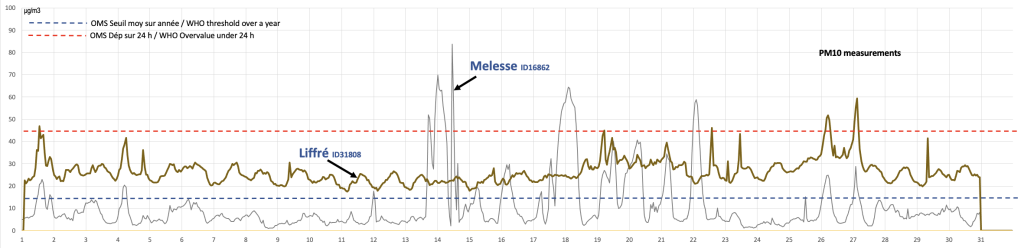
– ID31808 (north-east) gives excessive values appearing to present a constant bias in both PM10 and PM2.5 (average value not shown but readings displayed below).
– ID16862 has a high average value in relation to its surroundings; a peculiarity could exist at this location that should be verified.
– ID25365 (north-west) gives a value that is inconsistent with its surroundings and could be due to a sensor measurement fault.
Detailed measurements
Environmental temperature
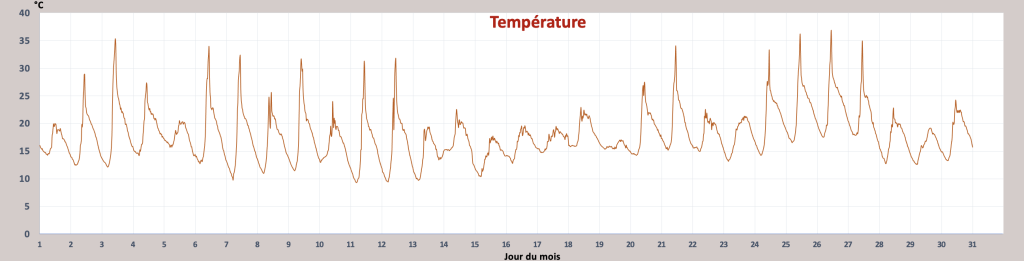
An average temperature of 17.9°C was recorded for the month on the sensor concerned; not all sensors have a functional temperature probe.
Temperature peaks above 25 – 30°C correspond to exposure of the sensor to the sun; thus, the period from June 13 to 19 corresponds to a period with little or no sunshine.
Particle concentration measurements on reliable sensors
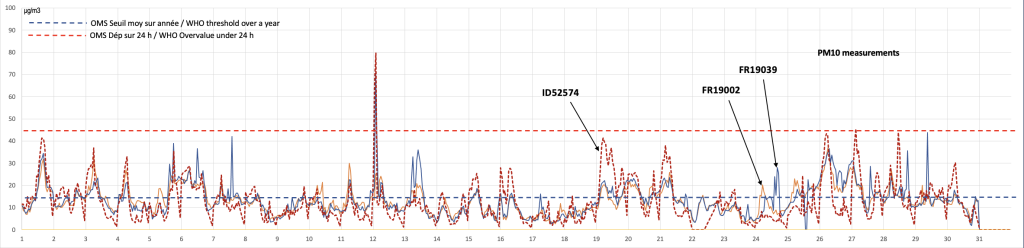
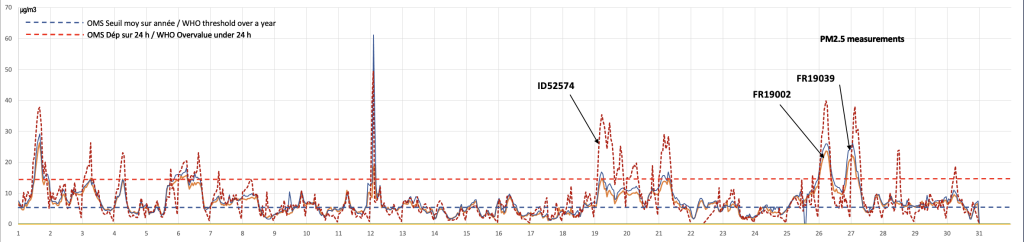
Calibration on official Atmo sensors
Citizen sensors are calibrated with Atmo sensors (FR19002 and FR19039) located in the city center.
The citizen sensor located closest to these sensors is ID52574; we can see that the dynamic response of this sensor is very close to that of the official sensors.
The citizen sensors are then calibrated with each other to ensure a consistent response between sensors located in the same zone. When the difference in response between certain sensors is too great, there may be doubts as to the correct operation of the sensors concerned; this is the case with sensor ID31808 mentioned above.
The overall response of all viable sensors
PM 10
PM 2.5
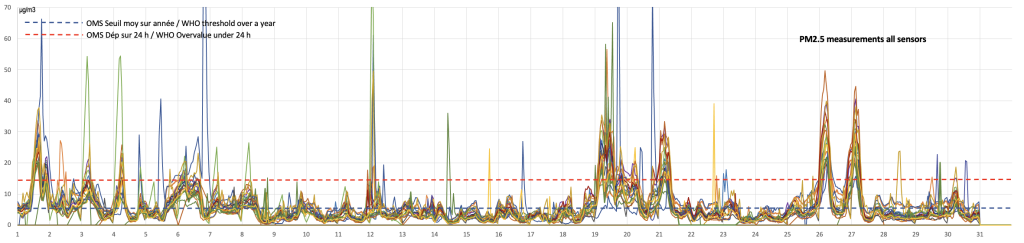
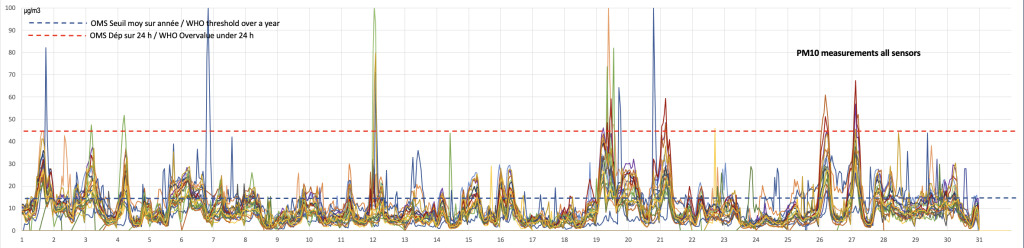
Generally speaking, sensor response is homogeneous around a mean value, so the dynamic response of the sensors is generally good. Peaks appear for certain sensors at their place of installation, the understanding and correlation of which remain to be studied.
There were, however, more marked periods of pollution common to the whole region, such as at the beginning of the month, between June 19 and 21, and from June 26 to 27.
Overall, the PM 10 environment remains compatible with WHO standards, while the PM 2.5 environment is more critical, particularly during the above-mentioned peak periods.
Questionable sensors
Two sensors were mentioned as dubious, one (located in Liffré) because of its high average (an uncommon bias in viable sensors), the other (located in Melesse) because of significant measurement peaks over long periods of time, the potentially real cause of which it would be interesting to investigate; we leave the pleasure of this investigation to the Rennes community.

Dynamic presentation of measurement points
To better interpret the measurement curves for each location, a dynamic presentation of the overall evolution of air quality in the area concerned is provided, showing the evolution of particle pollution both geographically and over time.
PM10 concentration trends in the Rennes region
Visualization
PM10 and PM2.5 in Rennes
The two videos opposite show the environment considered over the period June 1 to June 30, 2024. The accelerated speed corresponds to approximately 4 hours every second.
All valid measurement points (Air Breizh sensors and citizen sensors) are taken into account in these simulations.
PM2.5 concentration trends in the Rennes region